
Lumicre
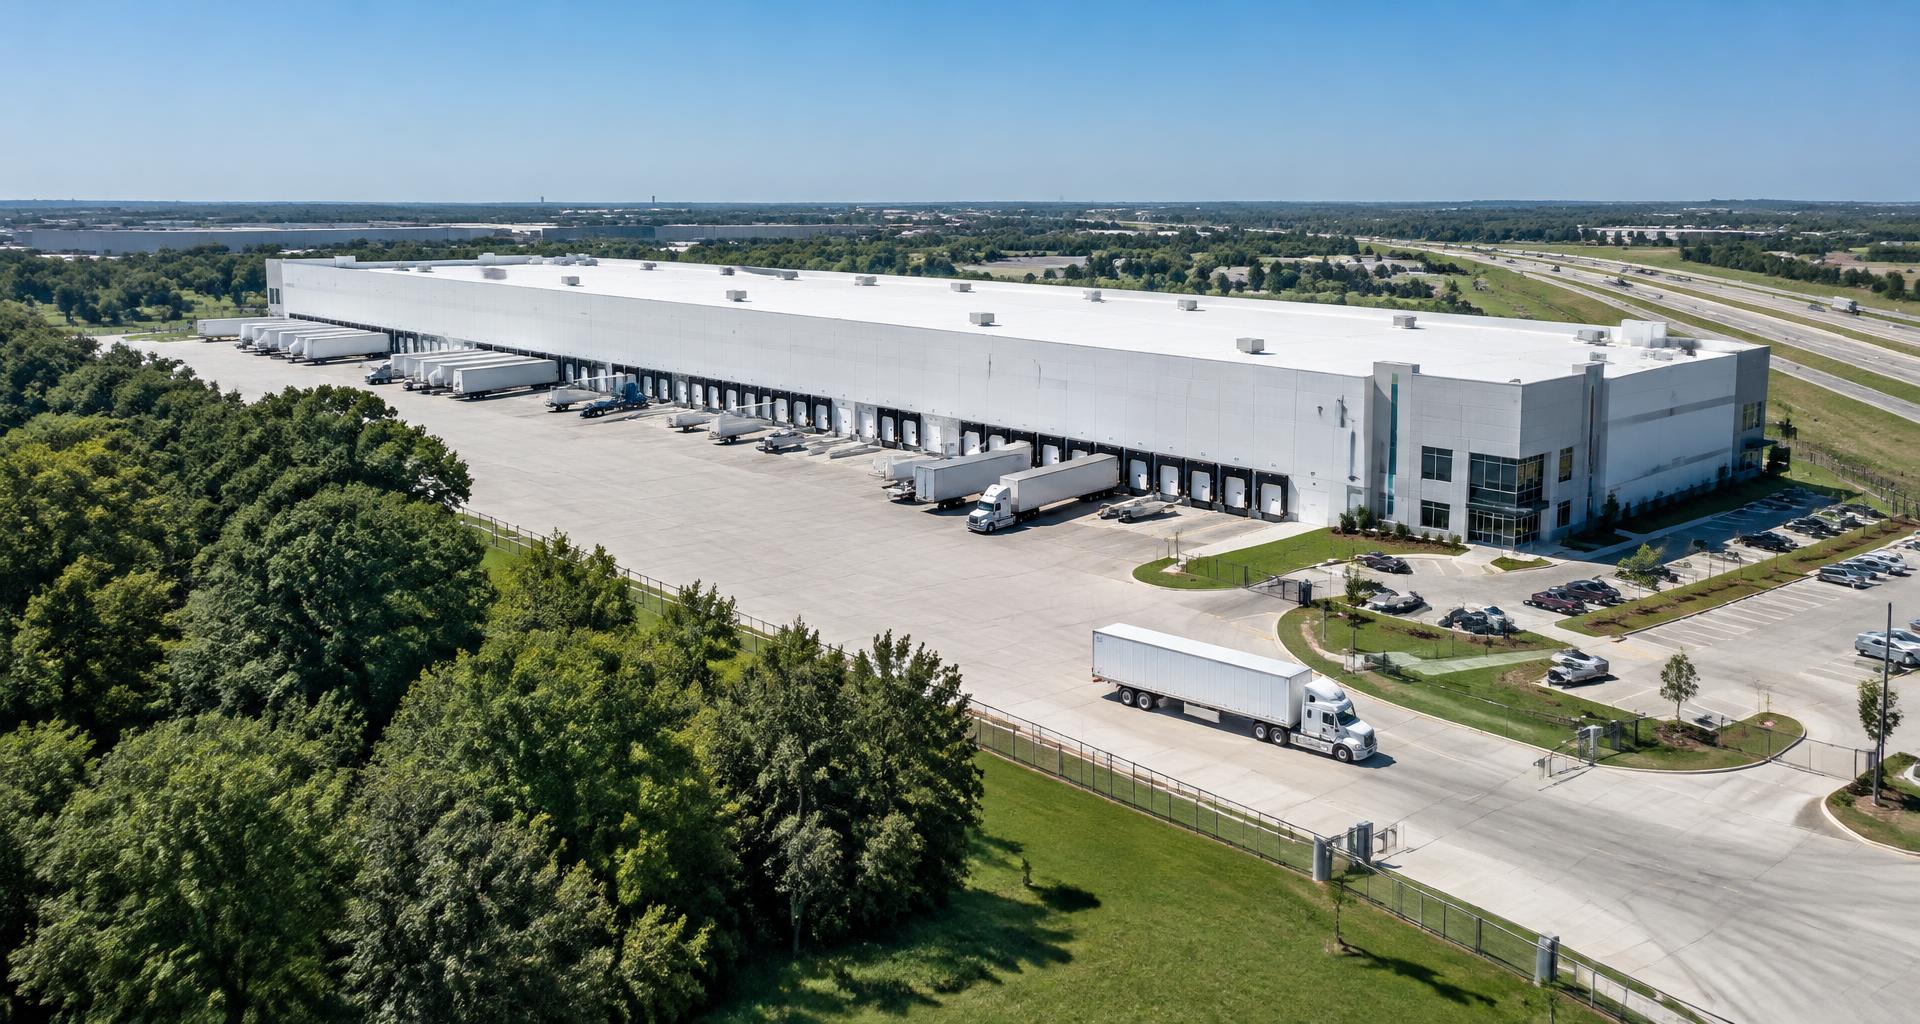
Illustrative texas logistics warehouse

Lumicre · Brokerage & Principal Advisory

Industrial & Logistics Property Sales.

Texas Triangle industrial and warehouse sales. Market insight and buyer-specific positioning for superior pricing, terms and surety of close.

29 years in business300+ transactions5M+ SF managed

Texas Triangle · Q3 2026

Four markets.
Distinct logistics advantages.

Distribution scale in DFW. Port connectivity in Houston. Manufacturing infrastructure in Austin. Cross-border access in San Antonio. The right sale strategy starts with the property’s role in that network.

Compare markets

01 / Q3 2026

Dallas–Fort Worth

Regional distribution at scale

Overall vacancy
7.8%
Quarterly net absorption
6.4M SF

Vacancy declined from 8.2% in Q2 to 7.8%. Quarterly demand absorbed 6.4 million SF while deliveries totaled 3.6 million SF. The 33.91 million SF construction pipeline remains a meaningful source of competition for existing properties.

Freight & industrial corridors: I-35E / I-35W, I-20 and I-30; DFW Airport and Alliance logistics corridors.

What this means for your sale

Differentiate your asset from new supply: document loading efficiency, trailer storage, highway access and the cost of bringing an older facility to a buyer’s specifications. Target distribution investors and owner-users whose requirements match the building.

02 / Q3 2026

Houston

Port-connected trade and manufacturing

Overall vacancy
7.0%
Quarterly net absorption
8.3M SF

Reported quarterly net absorption reached 8.3 million SF and 21.1 million SF year to date. Vacancy declined to 7.0%, down 30 basis points year over year. Average asking rents increased 10.4% year over year; owner-user acquisitions remain a segment to watch.

Freight & industrial corridors: Port Houston, I-10, I-45, US 290 and Beltway 8; Southeast, North and Northwest industrial districts.

What this means for your sale

Make the logistics story tangible: port access, truck routes, drainage, flood exposure, rail service where applicable and verified electrical capacity. Compare owner-user and investor offers on net proceeds, financing and closing conditions—not headline price alone.

03 / Q3 2026

Austin

Manufacturing demand meets supply overhang

Overall vacancy
19.3%
Quarterly net absorption
1.22M SF

Quarterly net absorption reached 1.22 million SF, but roughly 95% of the 918,000 SF delivered entered the market vacant. Year-to-date market leasing volume reached 9.77 million SF. Asking rents declined 2.1% year over year as recently delivered space continued to compete for demand.

Freight & industrial corridors: I-35 and SH 130; Southeast Austin, Round Rock and the Taylor manufacturing corridor.

What this means for your sale

Separate long-term manufacturing utility from near-term vacancy risk. Support the valuation with verified power, building condition, realistic carrying costs and comparable sales. For vacant assets, prioritize buyers with a credible use plan and demonstrated funding.

04 / Q3 2026

San Antonio

Cross-border connectivity and industrial production

Overall vacancy
10.3%
Quarterly net absorption
796K SF

Vacancy eased to 10.3%, with quarterly net absorption of 796,000 SF and approximately 698,000 SF of deliveries. The construction pipeline declined to 2.44 million SF. Submarket conditions differed sharply: South vacancy was 5.0%, versus 12.6% in the Northeast.

Freight & industrial corridors: I-35 toward Laredo and Austin, I-10 and Loop 410; South manufacturing and Northeast distribution corridors.

What this means for your sale

Price against the correct submarket and buyer use. Position manufacturing, distribution and shallow-bay properties around access, yard configuration, workforce proximity and replacement cost. Assess funding and closing certainty alongside the offer price.

Market Intelligence

Supply, demand & pricing context.

A dated Q3 2026 snapshot compiled from third-party market reports; coverage and methodology differ by publisher. Market leasing activity describes demand—not a service offered by Lumicre.

Texas Triangle industrial market comparison, Q3 2026
Q3 2026Dallas–Fort WorthHoustonAustinSan Antonio
Overall vacancy7.8%7.0%19.3%10.3%
Net absorption · quarter6.4M SF8.3M SF1.22M SF796K SF
Under construction33.91M SFNot included¹6.7M SF2.44M SF
Asking rent · $/SF/year²$10.39$10.43$11.57$8.81

¹ Houston’s underlying report does not publish a construction total; no estimate has been substituted. Net absorption is occupied space gained minus occupied space lost, not transaction volume.

² Asking rents are reported market averages, not achieved rents or sale-price indications. San Antonio’s rate is reported as direct NNN/year; the publishers’ rent coverage is not uniform. These observations are not forecasts, appraisals or guarantees of results.

Industrial & Logistics Sales Expertise

Know the asset.
Build the buyer’s conviction.

A warehouse is more than square footage. We translate its physical capabilities, income and logistics position into a sale package for buyers of choice—then negotiate for superior pricing, terms and surety of close.

01

Power & utility readiness

Review owner-provided electrical service, voltage, transformer capacity and utility correspondence. Distinguish existing capacity from an unconfirmed future upgrade.

02

Warehouse functionality

Document clear height, dock and grade-level loading, truck courts, trailer parking, column spacing, sprinkler systems and floor condition before buyer diligence.

03

Site & freight access

Evaluate highway connectivity, easements, yard use, rail access where applicable, drainage and floodplain constraints against the intended buyer’s operations.

04

Income & sale underwriting

Review rent rolls, existing lease obligations, tenant credit, rollover exposure and capital requirements to support a defensible pricing case—not a metro-average valuation.

05

Buyer-specific positioning

Tailor the property package for logistics investors, manufacturers, distributors, owner-users and developers whose capital and operating requirements fit the asset.

06

Offer quality & close

Compare price, proof of funds, financing contingencies, diligence scope, deposits and closing timing. Preserve backup options and apply our No Re-Trade Mandate within the signed agreement.

Discuss your industrial property

For property owners

Houston is a transportation hub connected by interstates, Port Houston and freight infrastructure. E-commerce, petrochemical and plastics exports inform industrial demand. We help owners market and sell industrial properties across the Texas Triangle to qualified buyers, pursuing superior terms, pricing and surety of close.

The Texas Triangle logistics advantage

01

Transportation hub

I-35, I-10 and I-45 connect the Texas Triangle’s consumption centers, manufacturing districts and distribution networks. Freight access is a property-specific competitive advantage.

02

Port access

Port Houston connects industrial users to international trade, including petrochemical and plastics exports.

03

Manufacturing infrastructure

Power, utility capacity, site configuration and workforce access shape industrial usefulness. Document verified capabilities rather than relying on a future upgrade or a metro-wide growth story.

04

Regional connections

DFW’s distribution network, Houston’s port access, Austin’s manufacturing corridors and San Antonio’s cross-border connections attract different buyer profiles. Position the asset for the buyer who values its advantages.

What owners ask us

How do you price my property?

We compare income, lease terms, condition and relevant sales, then test the price against the likely buyer pool.

What should I prepare before listing?

Start with leases, income and expense records, title, surveys and condition reports. We identify the remaining gaps.

What happens if a buyer changes the price?

Our No Re-Trade Mandate sets out the response. The signed contract controls termination and other remedies.

How we market and sell

01

Prepare

Review operations, leases, condition and constraints.

02

Position

Set the pricing case and assemble the buyer package.

03

Reach buyers

Profile buyers and launch property-specific outreach.

04

Compare offers

Evaluate price, funding, diligence and closing conditions.

05

Close

Coordinate advisers and resolve diligence through closing.

Infrastructure that supports industrial users

Houston connects major interstates, Port Houston, cargo rail and parcel shipping networks. Rail-served industrial properties are concentrated in the Southeast, Northwest and Northeast.

Our warehouse and industrial specialists market properties to buyers whose requirements fit the asset. We compare price, funding, diligence and closing terms for sellers across the Texas Triangle.

Why owners choose us

01

Deal Speed

Preparation and prompt follow-through.

02

Talent

Principal-level attention and operating experience.

03

Buyer Qualification

Evaluate buyer capital, track record and ability to close.

The investor side

Texas Logistics Infrastructure Fund I focuses on powered logistics. Explore Investments for offering information; this page remains focused on your warehouse disposition.

Latest Industrial Insights

Onshoring and Nearshoring: Why Texas Is Becoming North America’s Industrial Gateway (2026–2036)San Antonio Industrial Real Estate Market Report (2026)Corpus Christi Industrial Real Estate Market Report (2026)
View case studies

Request a Broker Opinion of Value

Free value opinion